SQL • Python • Power BI • DAX
Credit Risk Analytics
& Policy Scenario Analysis
End-to-end credit risk analytics focusing on customer behaviour, affordability indicators, and policy trade-offs.

SQL • Python • Power BI • DAX
End-to-end credit risk analytics focusing on customer behaviour, affordability indicators, and policy trade-offs.
This project analyses consumer credit risk at a portfolio level to identify high-risk customer segments and quantify how credit policy decisions impact approval volumes and default outcomes.
A SQL-first workflow was used for data preparation and feature engineering, followed by exploratory analysis and interactive dashboard development in Power BI.
~8%
Portfolio risk health~35%
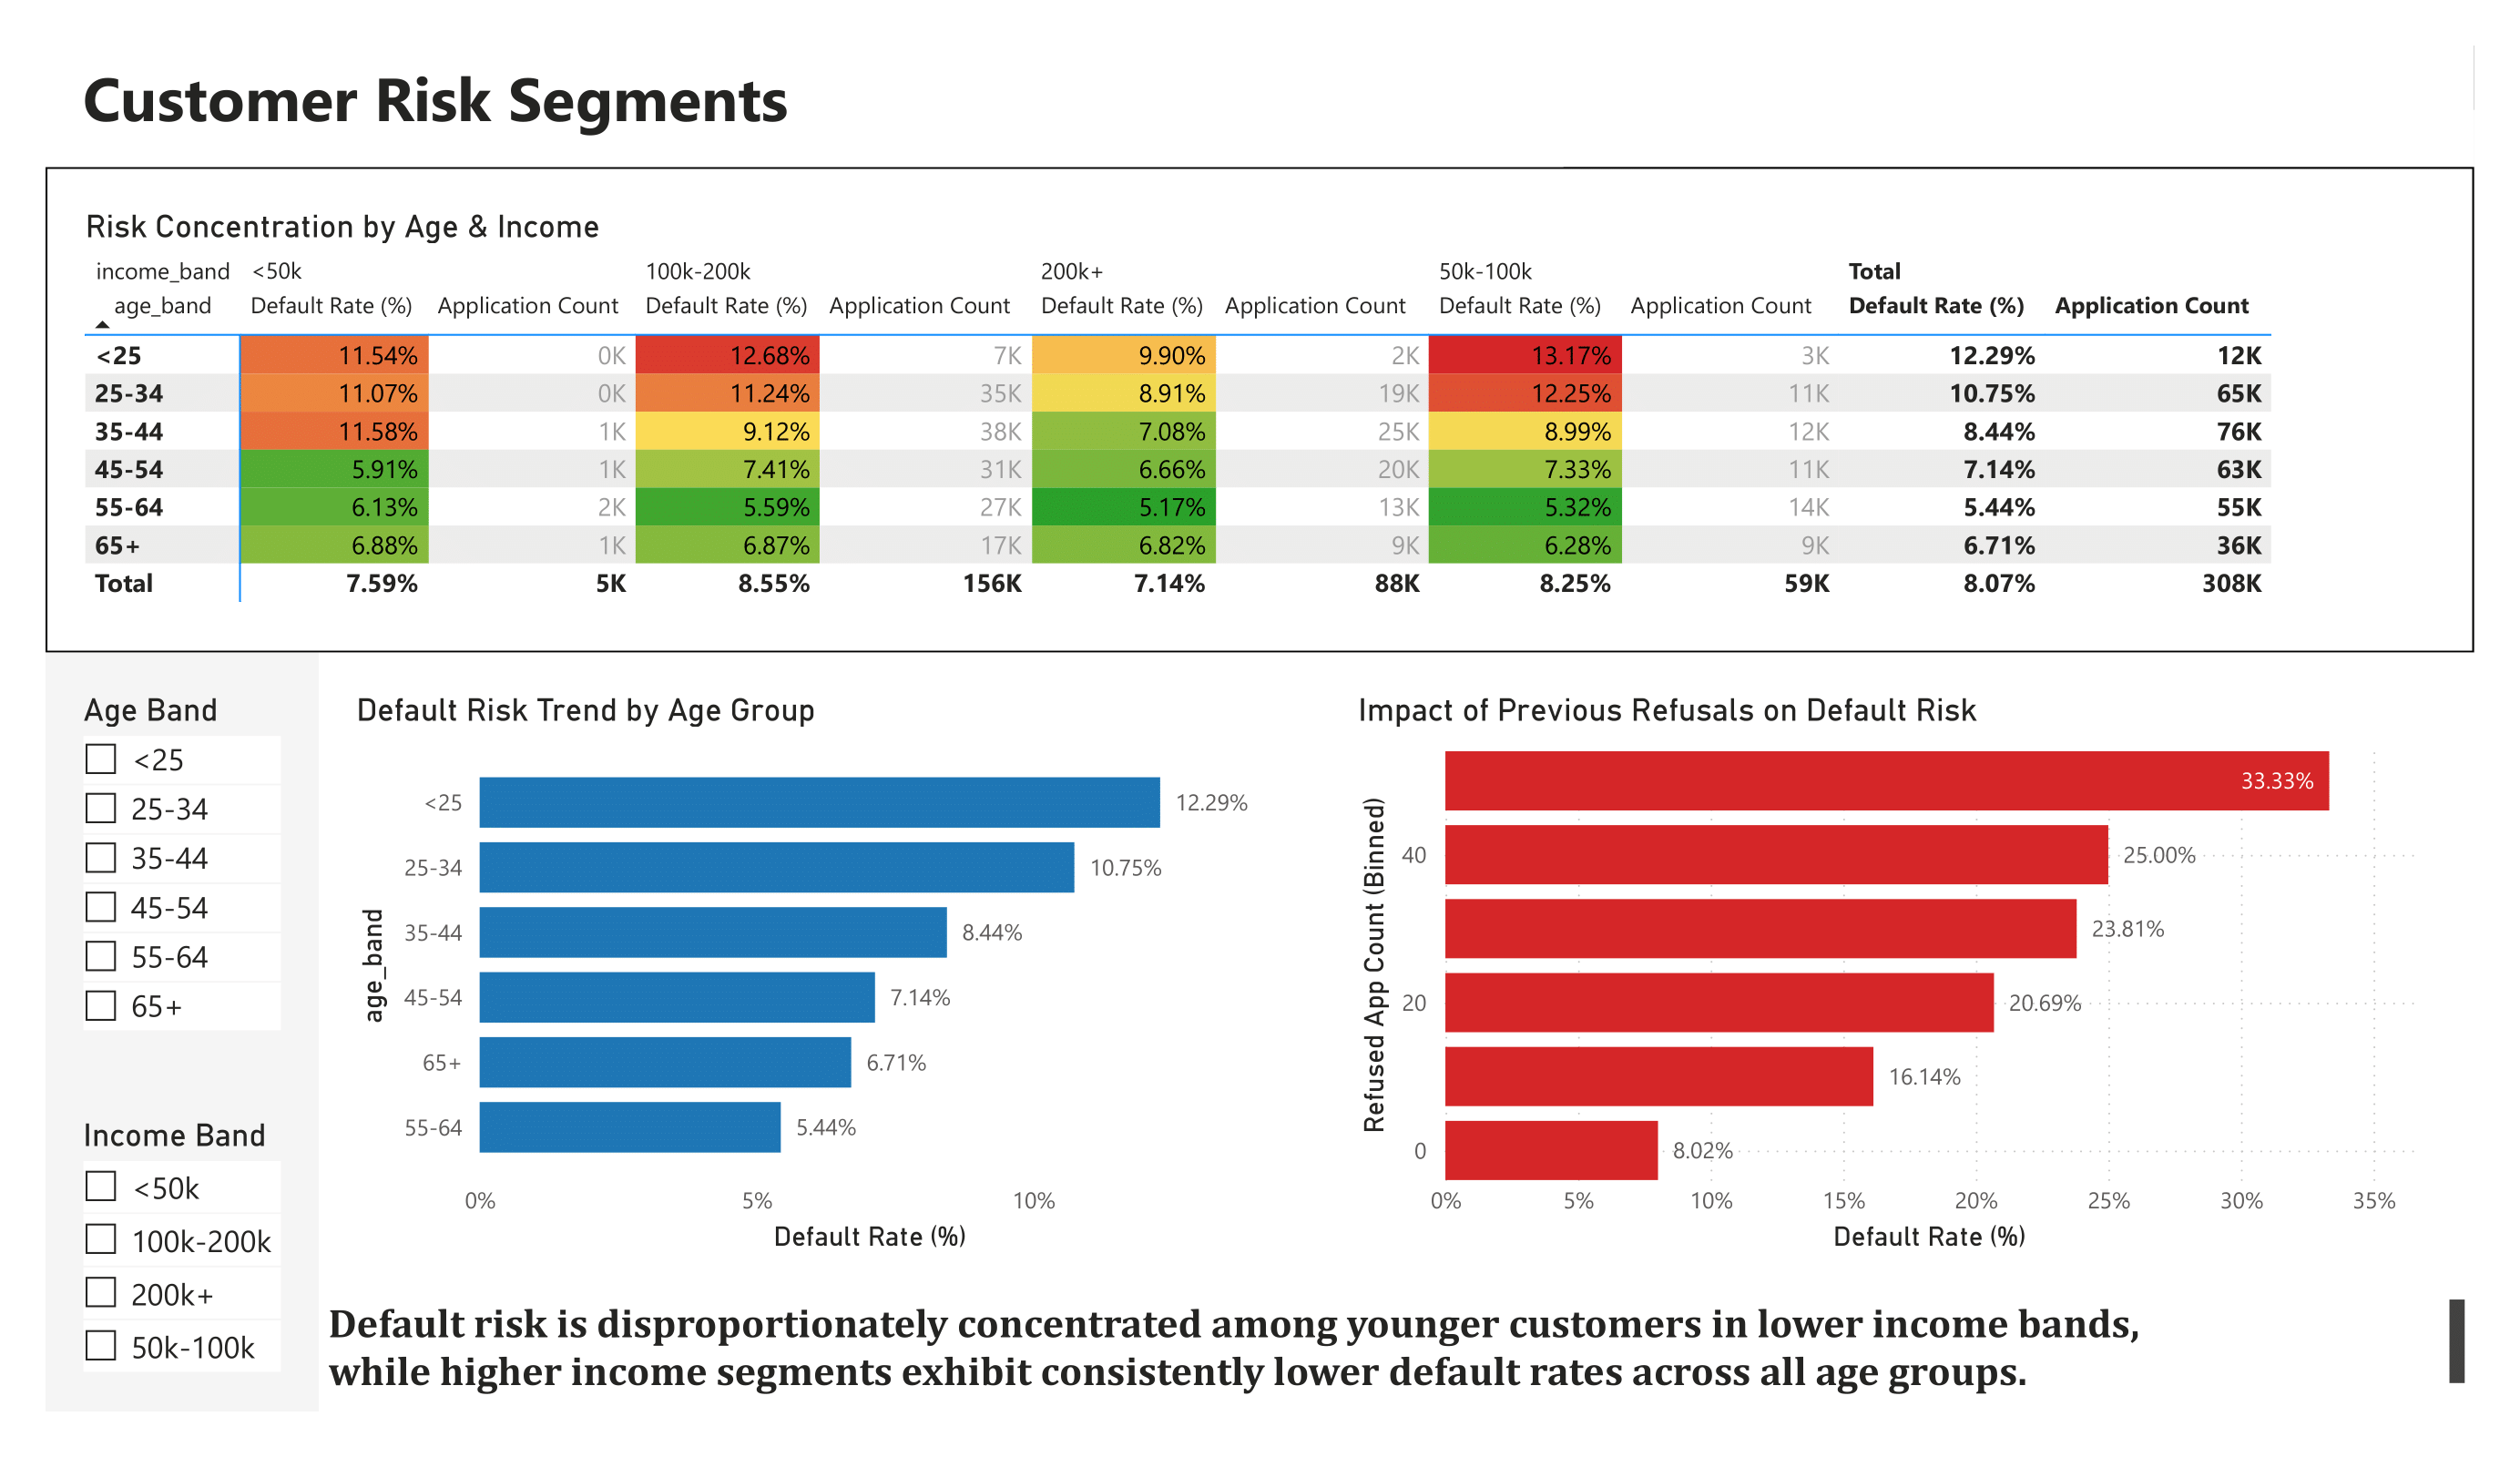
Risk concentrationApprovals ↑ / Risk ↑
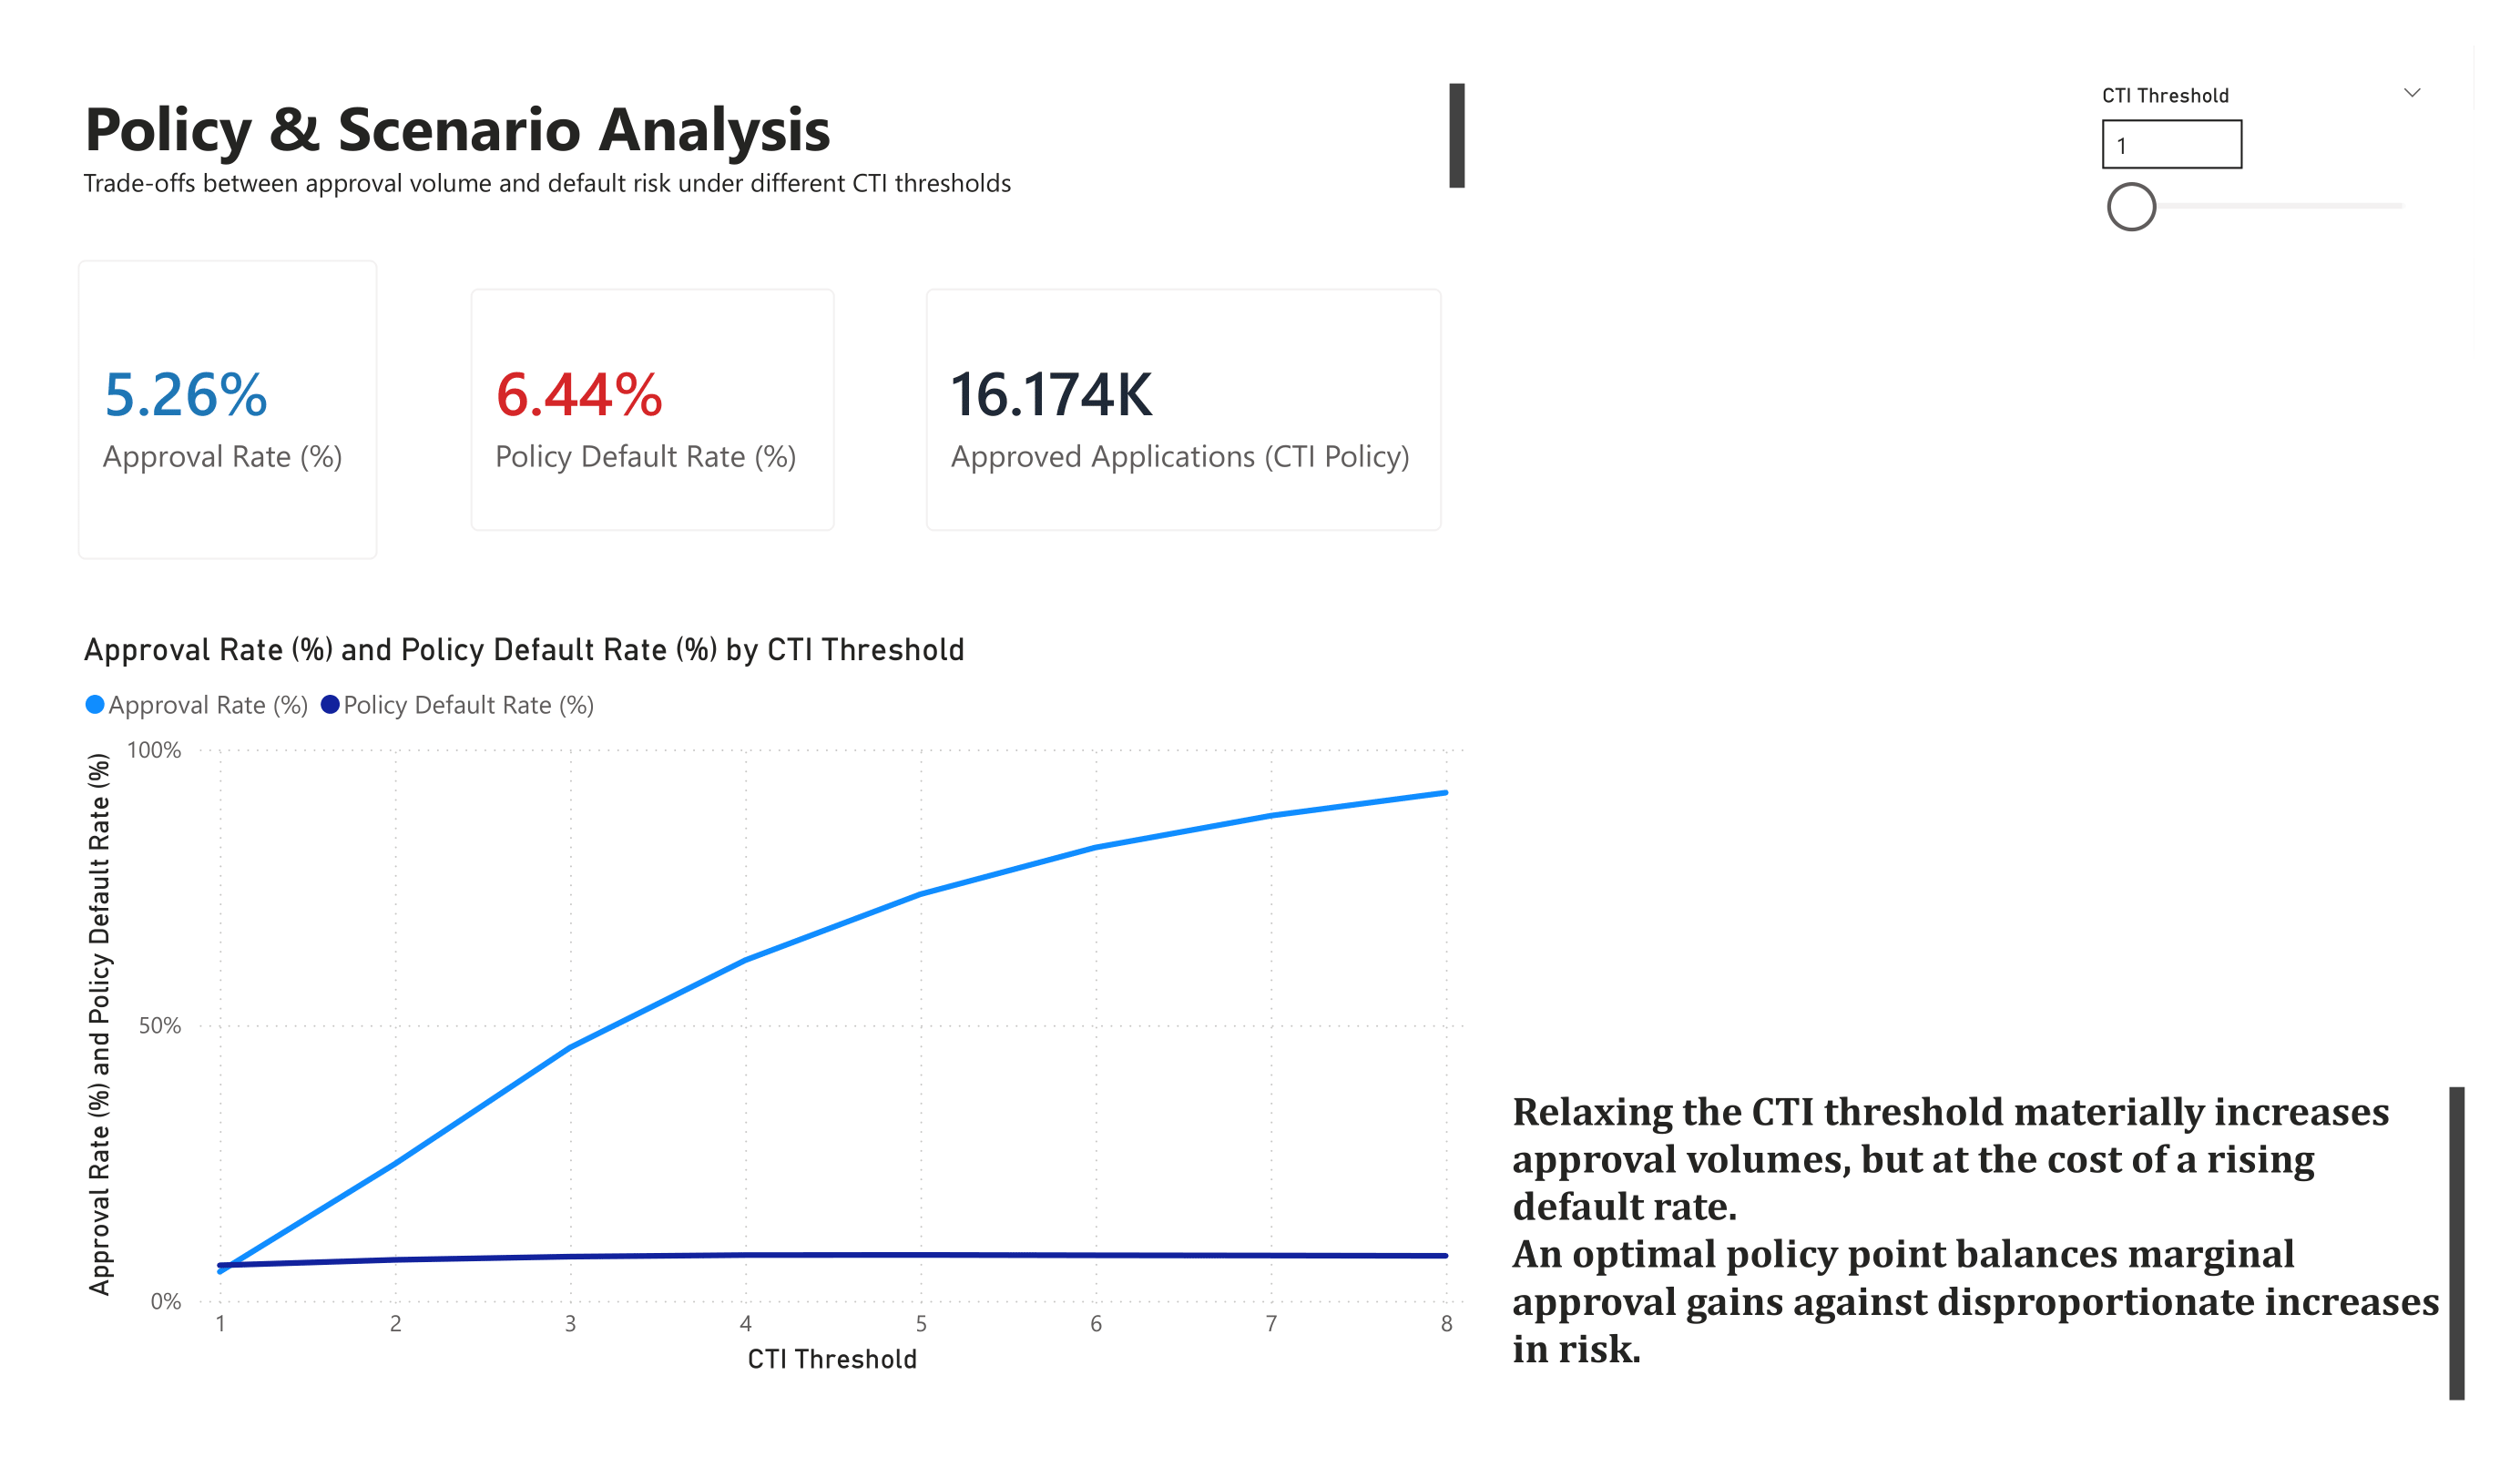
Policy optimisationRefusals ↑ defaults
Decision feature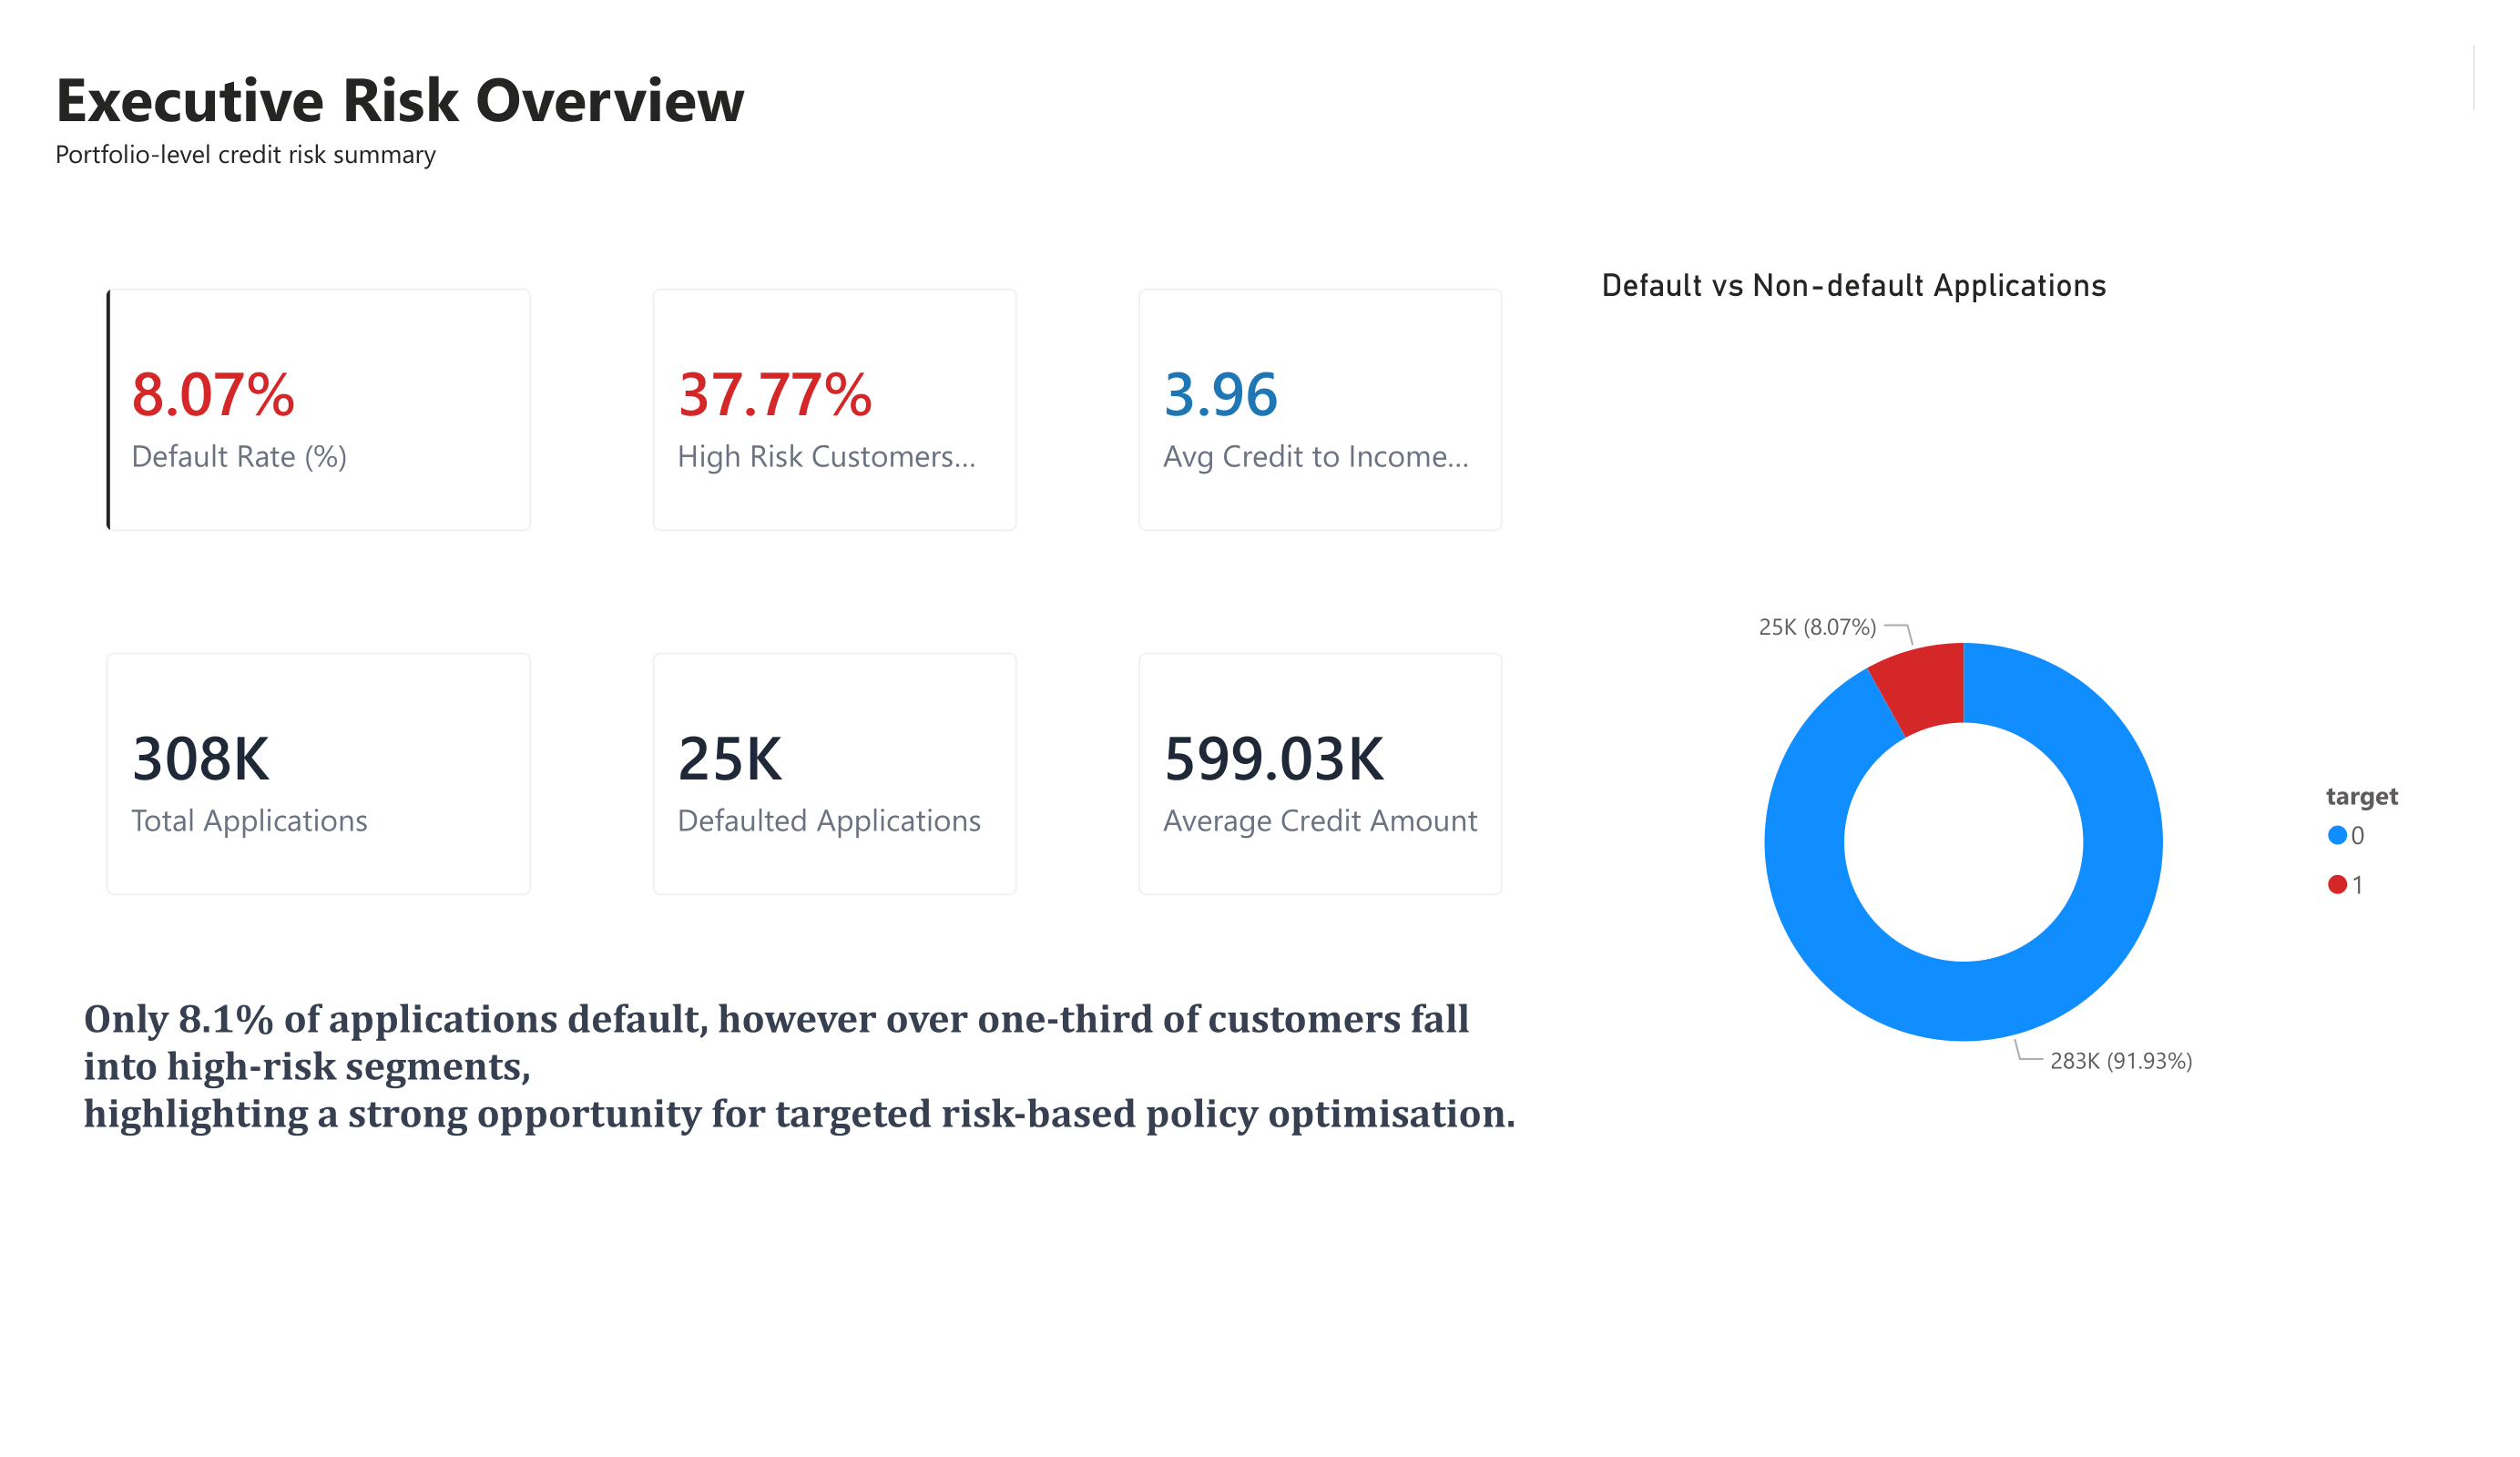
SELECT
  age_band,
  income_band,
  COUNT(*) AS applications,
  SUM(CASE WHEN default_flag = 1 THEN 1 ELSE 0 END) AS defaults,
  ROUND(
    SUM(CASE WHEN default_flag = 1 THEN 1 ELSE 0 END)::DECIMAL
    / COUNT(*) * 100, 2
  ) AS default_rate
FROM credit_applications
GROUP BY age_band, income_band
ORDER BY default_rate DESC;
This query underpins segment-level default analysis used to evaluate credit policy decisions.